Visualisation
You can visualise your simulation scenarios using the web application Kite.
Visualisation of the inputs
The dynamic input file can be uploaded in the “Origines / Destinations” tab.
You can then activate the visualisation of the origin/destination links and additional statistics in the third tab.
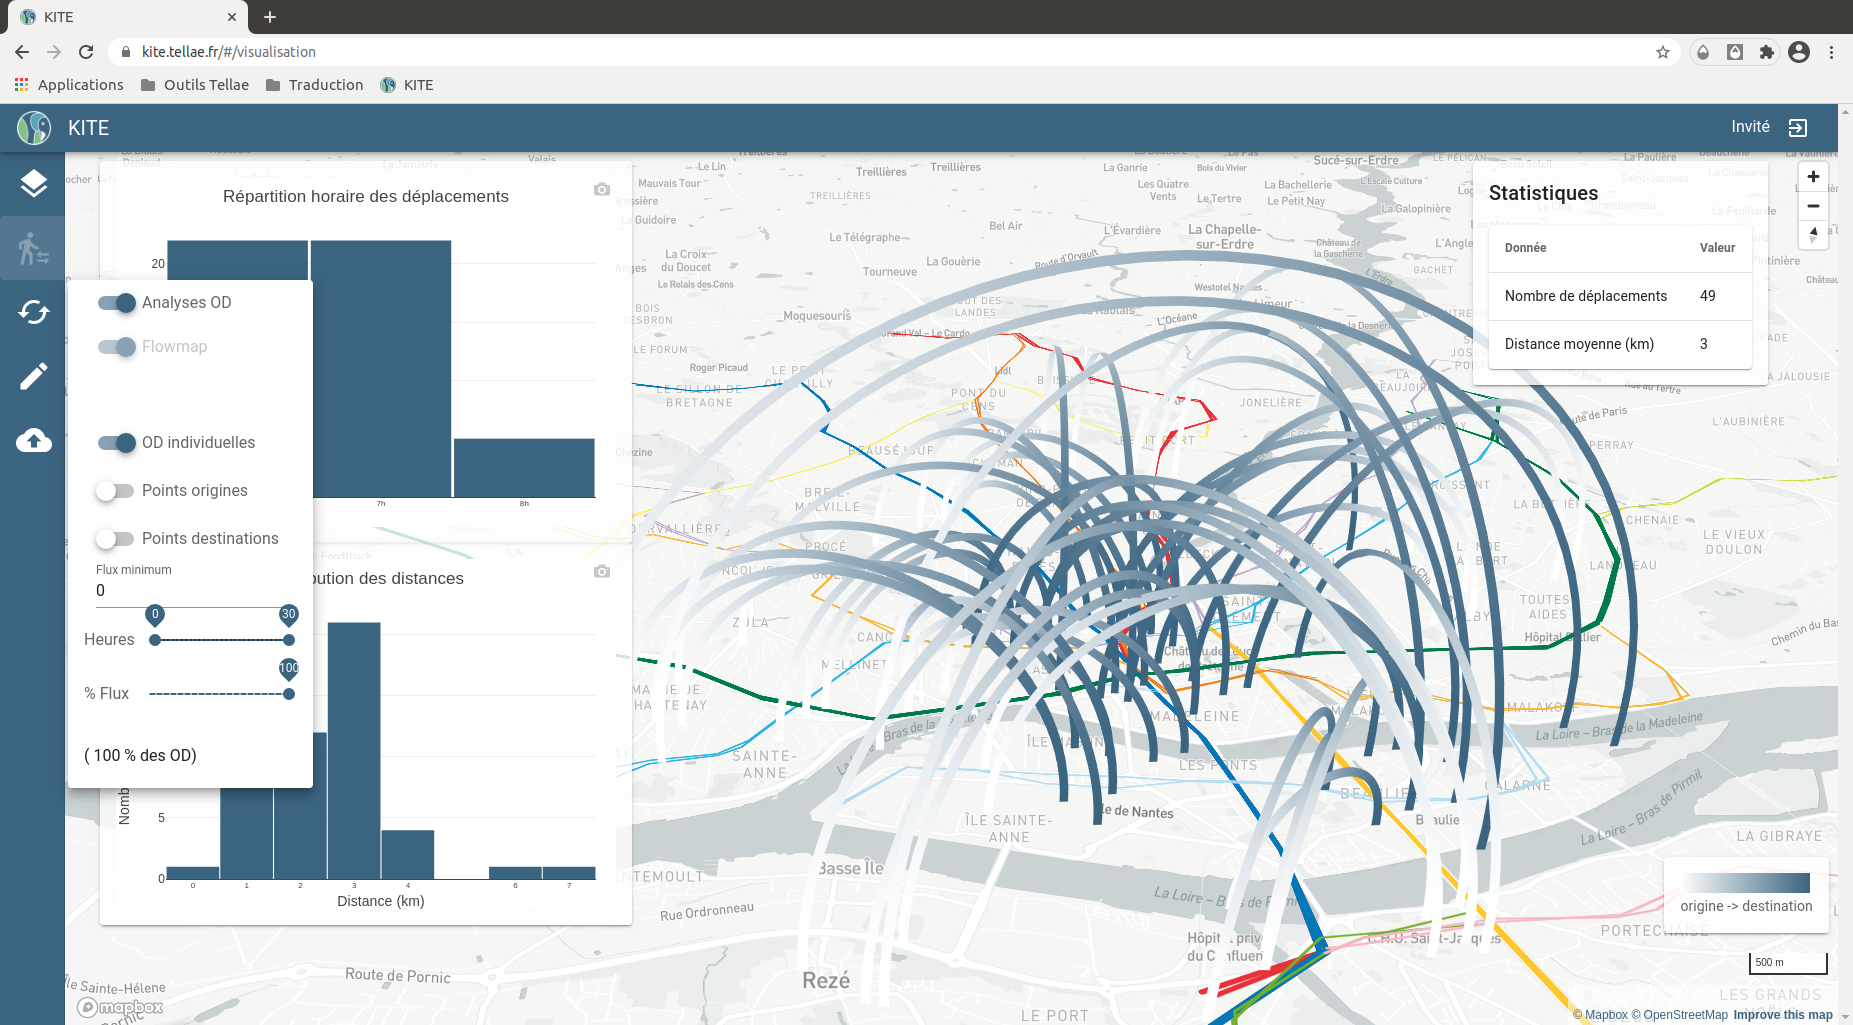
Visualisation of the input data using Kite
Visualisation of the output
The geojson output file can be uploaded in the “Traces dynamiques” tab.
You can then visualise dynamically the simulation run by clicking on “Zoom vers les données” and “Jouer / arrêter l’animation” buttons next to the timeline.
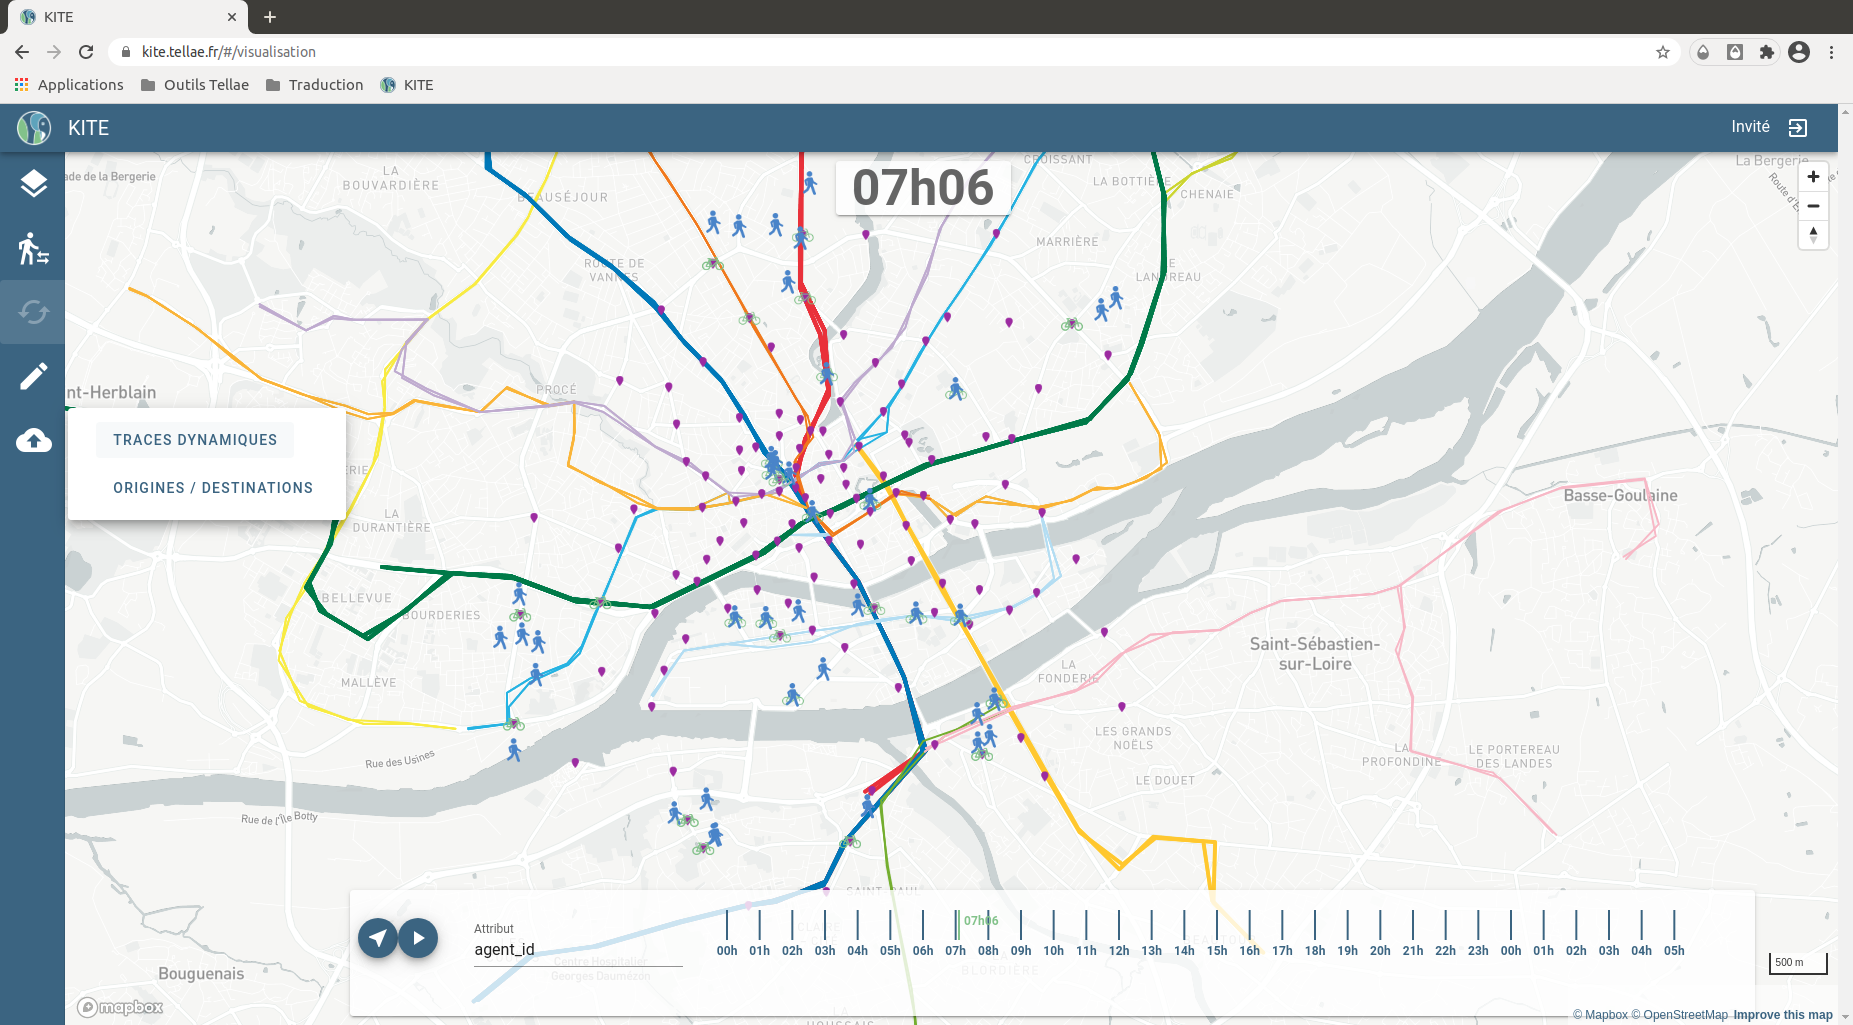
Visualisation of the simulation using Kite